



Market CloseNº 47·2Tuesday, Nov 17, 2026 · 5:00 PM ET
Gold Closes at $3,849.21 as a $35 Morning Rally Fades
Gold slipped −$6.64 / −0.17% after rising to $3,891.08 at about 10:30 AM ET as stocks fell. Silver rose +$0.44 / +0.93% to $47.40, and the gold/silver ratio eased to 81.2.
By the Ausecure Trading Desk · 8 min read
Gold
$3,849.21
−0.17% from $3,855.85 Monday
−0.7% from $3,878.05 Nov 13 close
−0.7% from $3,875.65 Oct 30 close
−10.8% from $4,322.61 Dec 31, spot
Silver
$47.40
+0.93% from $46.97 Monday
−2.7% from $48.73 Nov 13 close
−3.5% from $49.13 Oct 30 close
−34.4% from $71.64 Dec 31, spot
Fed odds: Ausecure estimate, the Federal Reserve Bank of Atlanta Market Probability Tracker’s latest reading (Nov 16) moved with the 2-year Treasury yield since then; next Fed decision Dec 9, 2:00 PM ET. The 10- and 30-yr yields are U.S. Treasury’s Nov 17 closes. The YTD tab uses spot daily closes. For general information only, not investment advice. Ausecure is a precious-metals dealer and sells the products discussed.
This market close note uses Ausecure prices at the 5:00 PM ET close on Nov 17, 2026. For the overnight climb and the retail sales report, see the pre-market note.
The short version
- How gold closed today: $3,849.21 an ounce at the 5:00 PM ET close, down −$6.64 / −0.17% from Monday’s $3,855.85.
- Silver price today: $47.40, up +$0.44 / +0.93%. Its gain came overnight.
- The rally: gold rose +$35 from 10:00 to 10:45 AM ET, to $3,891.08. Nasdaq 100 futures fell −1.2% and Treasury yields fell in the same half hour.
- The fade: gold gave back −$42 through the afternoon, while yields stayed lower and the dollar index slipped.
- Data: industrial production fell −0.4% in October, and builder sentiment dropped to its lowest since April 2012.
- Pete on Wall Street Bullion: Pete Thomas talked gold and silver with the channel today. Link to follow.
Why did gold slip today?
Our pre-market note had gold at $3,846.49 and silver at $47.45 at 8:45 AM ET. Gold closed +$2.72 above that, and silver −$0.05 below. Of gold’s −$6.64 loss on the day, −$9.36 came overnight and through the retail sales report. New York added back a little.
- After the data
- Gold rose +$21 from 8:45 to 9:45 AM ET, to $3,867.38, as the dollar gave back its retail sales jump. Industrial production missed at 9:15 AM ET. Gold slipped to $3,856.10 by 10:15 AM ET.
- The rally
- From 10:15 to 10:45 AM ET gold rose +$35 to $3,891.08 on more than four times normal volume. Nasdaq 100 futures fell −1.2% from 10:00 to 10:30 AM ET. The 2-year Treasury yield fell about 0.04 point, and the dollar index slipped to 103.49. Reports of tankers hit near Hormuz, an Iranian attack on U.S. sites in Bahrain and U.S. strikes on Iran’s Qeshm Island ran in the same window.
- The fade
- Gold fell back in small steps for six hours, to $3,849.21 at the close. No single 15-minute bar after 11:00 AM ET lost more than $8. Volume fell to less than half of the rally’s. The dollar index hit its low of 103.38 at 2:30 PM ET, and gold didn’t rise with it.
Our read is that gold rose with Treasuries as stocks fell, and the buying faded once stocks steadied. We can see the timing and the volume, not who bought or sold. Later Gulf headlines, including a U.S. official’s confirmation of the Qeshm strike at about 2:45 PM ET, came with no rise in gold.
Gold, past two weeks
Today’s economic data and what it means
| Report | Forecast | Actual | What it means |
|---|---|---|---|
| Retail sales | 0.1% | 0.2% | October, 8:30 AM ET. Ex-autos +0.6%. Spending held up |
| Import prices | 0.7% | 1.1% | October, 8:30 AM ET. Fuel led. Our figure from BLS index levels |
| Industrial output | 0.1% | −0.4% | October, 9:15 AM ET. Utilities fell 4.3%, factories rose 0.3% |
| Capacity use | n/a | 76.4% | Down from 76.8% in September |
| Builder index | n/a | 25 | November, 10:00 AM ET. Down from 29, lowest since April 2012 |
| 6-week bill | n/a | 4.055% | Auction result. Bids covered 2.82 times |
- Retail sales and import prices
- The morning note covered these. Sales rose 0.2% against a 0.1% forecast, the Census Bureau said, and 0.6% without autos. Gold fell −$20.50 inside the release bar, to $3,836.96, its low for the day.
- Industrial production
- The Federal Reserve said output fell −0.4% in October, against a forecast of a 0.1% rise. September held at +0.7%, and August was revised to −0.1%. Utilities fell 4.3% and manufacturing rose 0.3%. Capacity use slipped to 76.4%. Gold rose +$2.88 in the release bar.
- Builder sentiment
- The National Association of Home Builders’ index fell to 25 from 29, its lowest since April 2012. The group said 46% of builders cut prices. Mortgage rates above 7% weigh on housing, and a weak housing market works against more Fed hikes. Gold slipped −$3.40 in the release bar, then started its rally 15 minutes later.
What it adds up to: strong spending in the morning, then weak factories and housing. The 2-year yield ended 0.03 point lower. Our estimate of December hike odds is about 97%. The next big event is the minutes of the Fed’s October meeting on Wednesday at 2:00 PM ET.
How much was the dollar?
The dollar index closed at 103.56, down −0.02% from Monday. It peaked at 103.72 after the retail sales report and fell to 103.38 by 2:30 PM ET. Over the past two weeks gold is down −2.3% and the dollar is up +1.8%.
Treasury’s figures had the 10-year yield at 5.10% and the 30-year at 5.46%, down −0.02 pt and unchanged. The 2-year fell −0.03 pt to 4.80%. The 10-year real yield fell −0.03 pt to 2.89%, after a 0.23 point rise over the previous five days. The 10-year breakeven was 2.21%. The average 30-year fixed mortgage rate was 7.11% in Freddie Mac’s weekly survey (Nov 12), down −0.07 pt from a week earlier. The 15-year was 6.45%.
Gold vs. the U.S. dollar, % change over two weeks
Prices have moved since the close. Our live metal prices page has bid and ask for gold, silver, platinum and palladium, updated as the market moves.
The Fed: minutes on Wednesday
Governor Christopher Waller spoke on payments and tokenized markets at 9:10 AM ET. His text didn’t mention rates. St. Louis Fed President Alberto Musalem’s call for “several interest rate increases before the spring of 2027,” Reuters reported this morning, is in the pre-market note.
By our estimate, markets price a December 9 hike at about 97%. The Atlanta Fed’s tracker read 98% on Monday.
| Meeting | Atlanta | Today | What it means |
|---|---|---|---|
| Dec 9 hike | 98% | 97% | Odds of a quarter-point hike to 4.00–4.25%. Atlanta = Monday’s tracker reading. 96% at Monday’s close |
| Jan 27 hike | 68% | 66% | Odds of a second hike, to 4.25–4.50%, by January 27. 68% at Monday’s close |
Our estimate moves the Atlanta Fed tracker’s latest reading, from Monday, with the 2-year yield since then. The 2-year is down about −0.01 pt since that reading. The minutes of the Oct 27–28 meeting come out Wednesday at 2:00 PM ET.
Stocks and the news
U.S. stocks fell. At the 5:00 PM ET close, S&P 500 index futures were down −0.9% and Nasdaq 100 futures −0.6%. The VIX rose to 27.7 during the day, CNBC reported, as outages hit Apple and the National Security Agency’s internal network. After the close, Nvidia reported earnings above forecasts, and its shares rose about 2% in late trading, CNBC reported.
- Hormuz
- At least five ships were hit in and around the Strait of Hormuz on Tuesday, Al Jazeera’s tally showed. Iran’s navy said tankers hit mines. Gold’s rally ran from 10:15 to 10:45 AM ET, while these reports came out. It gave the gain back.
- Iran and the U.S.
- Iran’s Revolutionary Guards launched drones at a U.S. radar site in Bahrain, and the U.S. military said it intercepted them. A U.S. official said U.S. jets struck a missile site on Qeshm Island. President Trump said Iran would “pay a price” if a reported plot against Washington were real. The White House said there was no credible threat.
- Gold Council
- The World Gold Council said China’s central bank added 26 tonnes of gold in October, its 24th straight month of buying. No new ETF data today.
Pete Thomas on Wall Street Bullion

Ausecure chairman Pete Thomas talked gold and silver with Wall Street Bullion today. We’ll add the link here when the episode is out.
Silver price today: up 0.93%, at $47.40
Silver closed at $47.40, up +$0.44 from Monday’s close of $46.97. It rose to $48.02 by 12:30 AM ET, then gave back half of that before New York opened. In New York it moved with gold. It rose to $47.99 near gold’s high and ended below this morning’s $47.45.
The ratio fell −0.90 from 82.10 at Monday’s close to 81.20. Silver’s overnight climb did it. Through the New York session the ratio held between about 80.8 and 81.5. The Silver Institute forecasts a sixth straight market deficit in 2026, of 35 million ounces.
Gold/silver ratio, past two weeks
Gold/silver ratio: how it has moved with gold over 90 days
Silver has moved with gold and further. From daily spot closes, Aug 19 to Nov 17 (65 trading days):
Gold/silver ratio, daily spot close
Biggest one-day risesBiggest one-day falls
- Sep 10Ratio +2.48 as gold fell 1.9% and silver 5.5%.
- Oct 14Ratio +3.46, the biggest one-day rise, as gold fell 1.3% and silver 6.0%.
- Oct 20Ratio −1.38 as gold fell 0.4% and silver rose 1.6%.
- Oct 22Ratio +2.29 as gold fell 2.8% and silver 5.8%.
- Nov 4Ratio −1.19 as gold rose 3.3% and silver rose 4.9%.
- Nov 16Ratio +2.45 to 82.10, the 90-day high, as gold fell 0.7% and silver 3.7%.
Each dot is one day in the 90 days. Across: gold’s change. Up: silver’s.
Black line: silver’s average move against gold’s over 90 days. Dashed: a move the same size as gold’s. 1 month: 1.5×. 1 year: 1.9×.
| Level | Ratio | Note |
|---|---|---|
| 1-month and 90-day and 1-year high | 82.10 | Nov 16 |
| Today’s close | 81.20 | Nov 17 |
| 1-month low | 71.13 | Oct 20 |
| 90-day low | 65.00 | Sep 22 |
| 1-year low | 46.29 | Jan 27 |
1 month: since the Oct 16 close. 90 days: since Aug 19. 1 year: since Nov 17, 2025. All to today’s close, from daily spot closes.
Over 90 days silver’s daily move has averaged 1.51 times gold’s, and 1.46 times over the past month. Today silver rose while gold slipped, so the ratio fell −0.90 to 81.20, 0.90 below Monday’s 90-day high. In our 15-minute data the drop came overnight, as silver climbed to $48.02; through the New York session the ratio stayed between about 80.8 and 81.5.
Gold/silver ratio: where 81.2 sits in the longer history
From daily spot closes since 2000, and the 2-year Treasury yield from the Federal Reserve:
- Before this week
- The last close this high was 81.26 on Nov 21, 2025, with gold at $4,065.00 and silver at $50.02. A month later the ratio was 64.35, with gold up +9.3% and silver up +38.1%. That is one case, inside silver’s run to its record.
- A year ago
- A year ago (Nov 14, 2025) the ratio was 80.77, with gold at $4,085.80 and silver at $50.58. Today’s close is +0.43 points higher. Gold is down −5.8% over the year and silver −6.3%.
- Before gold’s record
- The ratio was 90.83 six months before gold’s record close of $5,418.50 on Jan 28, 2026, and 46.37 on the day.
- Rate days
- Since gold’s record, the 2-year yield fell 0.05 point or more on 23 days, and gold fell on 6 of them. Today’s 0.03 point fall was too small to count.
| Ratio level | Ratio | Why it matters |
|---|---|---|
| Mon close | 82.10 | The highest daily close in a year, where today started |
| Nov 21, 2025 | 81.26 | The last close this high before this week |
| Today’s close | 81.20 | 5:00 PM ET |
| This morning | 81.07 | 8:45 AM ET, in the pre-market note |
| A year ago | 80.77 | Nov 14, 2025 daily close |
| 1-month median | 77.45 | Daily closes since Oct 16 |
| 90-day median | 68.49 | Daily closes since Aug 19 |
| At gold’s record | 46.37 | Jan 28, 2026 |
In the past 90 days, the ratio fell on days silver rose more than gold. Today fit that pattern. That is a description of recent trading, not a forecast.
Gold and silver price levels after the close
| Level | Gold | Silver | Why it matters |
|---|---|---|---|
| Day highs | $3,891.08 | $48.02 | Gold’s at 10:30 AM ET, in the rally. Silver’s at 12:30 AM ET |
| Mon close | $3,855.85 | $46.97 | Where today started. Gold closed below it, silver above |
| Round number | $3,850 | $47.00 | Gold closed just under it. Silver has closed above $47 since Monday night |
| Today’s close | $3,849.21 | $47.40 | 5:00 PM ET |
| Morning level | $3,846.49 | $47.45 | 8:45 AM ET, in the pre-market note |
| Day lows | $3,836.96 | $46.83 | Gold’s at 8:30 AM ET, on retail sales. Silver’s at 8:00 PM ET Monday |
| Mon night low | $3,832.46 | $46.55 | Gold’s lowest since early October 2025. Silver’s figure is Monday’s low |
Gold’s range today was $54.12, inside Monday’s range of $3,832.46 to $3,901.37. It closed −$41.87 below its high. Silver’s range was $1.18. That is a description of past trading, not a forecast.
Trend check
On our monthly trend model, both metals read bear as of the Oct 30 month-end. From 2008 to October 2026, gold rose in the month after a bear month 49% of the time; that is history, not a forecast. Gold’s live 12-month return, after cash returns, is 10.1% below zero, and an 11.3% rise would turn it. Silver’s is 11.2% below zero.
Economic calendar: what’s next for gold
- Wed Nov 18, 2:00 PM ET
- Minutes of the Fed’s October meeting. San Francisco Fed President Mary Daly speaks at 12:15 PM ET, and Governor Michael Barr at 1:35 PM ET.
- Thu Nov 19, 8:30 AM ET
- Weekly jobless claims. Freddie Mac’s mortgage survey at noon ET.
- Fri Nov 20, 10:00 AM ET
- University of Michigan consumer sentiment.
Market Notes by email
Gold and silver insights in your inbox
The weekly email every weekend, plus monthly, quarterly and yearly wrap-ups: how gold and silver closed, what moved them, and the levels ahead.
Read the latest weekly email (Sunday, Nov 15) or the October wrap-up.
This weekAusecure closing ask
| Day | Gold | Change | Silver | Silver change |
|---|---|---|---|---|
| MonNov 16 | $3,860.40 | −0.6% | $47.12 | −3.6% |
| TueNov 17 | $3,853.50 | −0.2% | $47.53 | +0.9% |
| WeekendWeekly email | Read last week’s | |||
You’re subscribed.Our emails will go to .
Buying metal too? A free account lets you order at live prices and track every shipment.
What today’s move means if you buy physical gold or silver
Gold closed −$6.64 lower after a +$35 rally in the morning. Silver closed +$0.44 higher.
- Your price
- Gold moved $35 in 30 minutes this morning. The price you lock in is the one on screen when you place the order.
- Silver and gold can split
- Check each metal’s price on its own before you order.
- Premium
- Most products on our site show their “% over spot” under the price, so you can compare a coin with a bar on equal terms.
- Paying
- Wire, paper check and crypto via Uphold pay the listed price. Credit or debit card, Apple Pay and Google Pay pay the card price. U.S. orders of $2,000 or more ship free and insured.
- Retirement
- See which coins and bars meet the fineness rules on our IRA-eligible metals page.
- Selling
- We make two-way markets. Call the desk at 1-855-528-4653 for a live bid, or see how selling works.
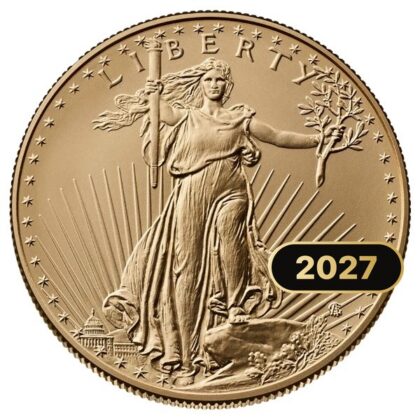
If you would rather not time it, Auto-Buy places a recurring order for American Eagles or a 10 oz silver bar, weekly to every two months, at the live price on each order date. Every Auto-Buy order ships free and insured, you get a reminder before each one, and you can skip, pause or cancel anytime.
Silver, past two weeks
Coins and bars from the U.S. Mint, Royal Canadian Mint, PAMP, Valcambi and more: shop gold or shop silver. Every order is 100% insured, tracked and shipped discreetly.
From our store tonight
Our listed prices at 5:10 PM ET, for wire, paper check or crypto via Uphold; the card price is on each product page. Prices move with the live market and are confirmed when you order.
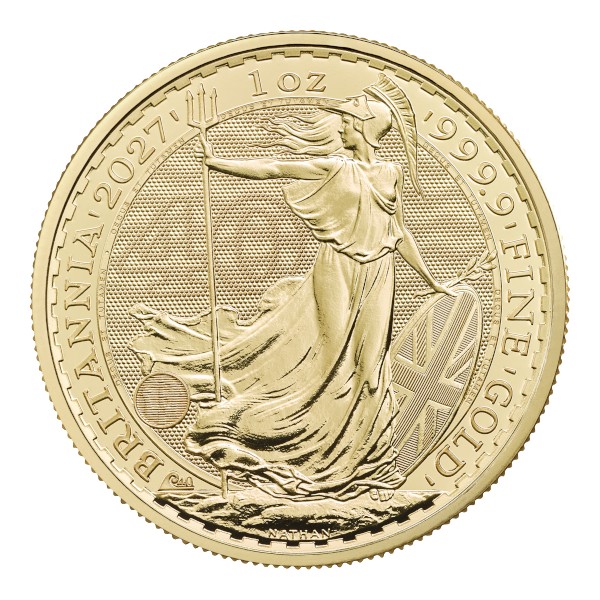
$4,094.48
From the Royal Mint. .9999 fine gold, £100 face value, United Kingdom legal tender. IRA-eligible.
View it
$2,045.41
.9999 fine gold, sealed in its assay card. Veriscan lets you check the bar with a phone app. IRA-eligible.
View it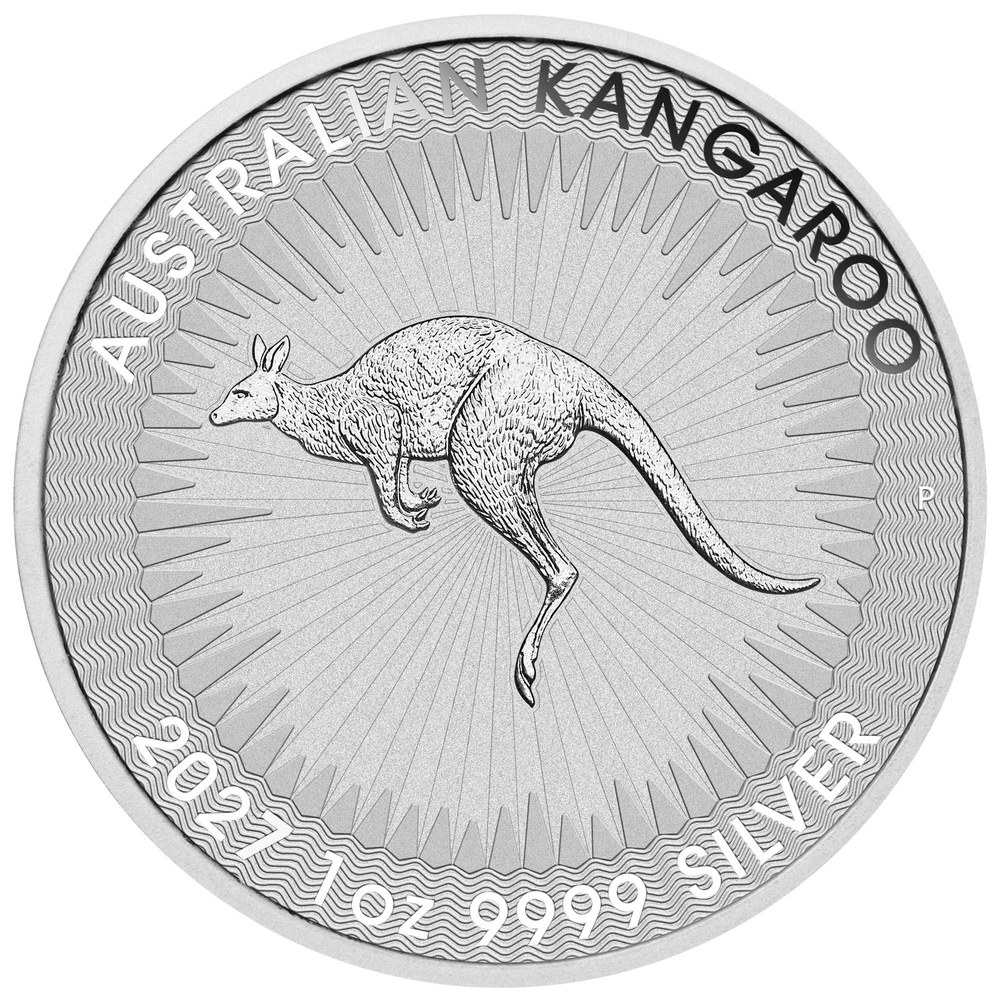
$51.47
From the Perth Mint. .9999 fine silver, $1 face value, Australian legal tender. IRA-eligible.
View it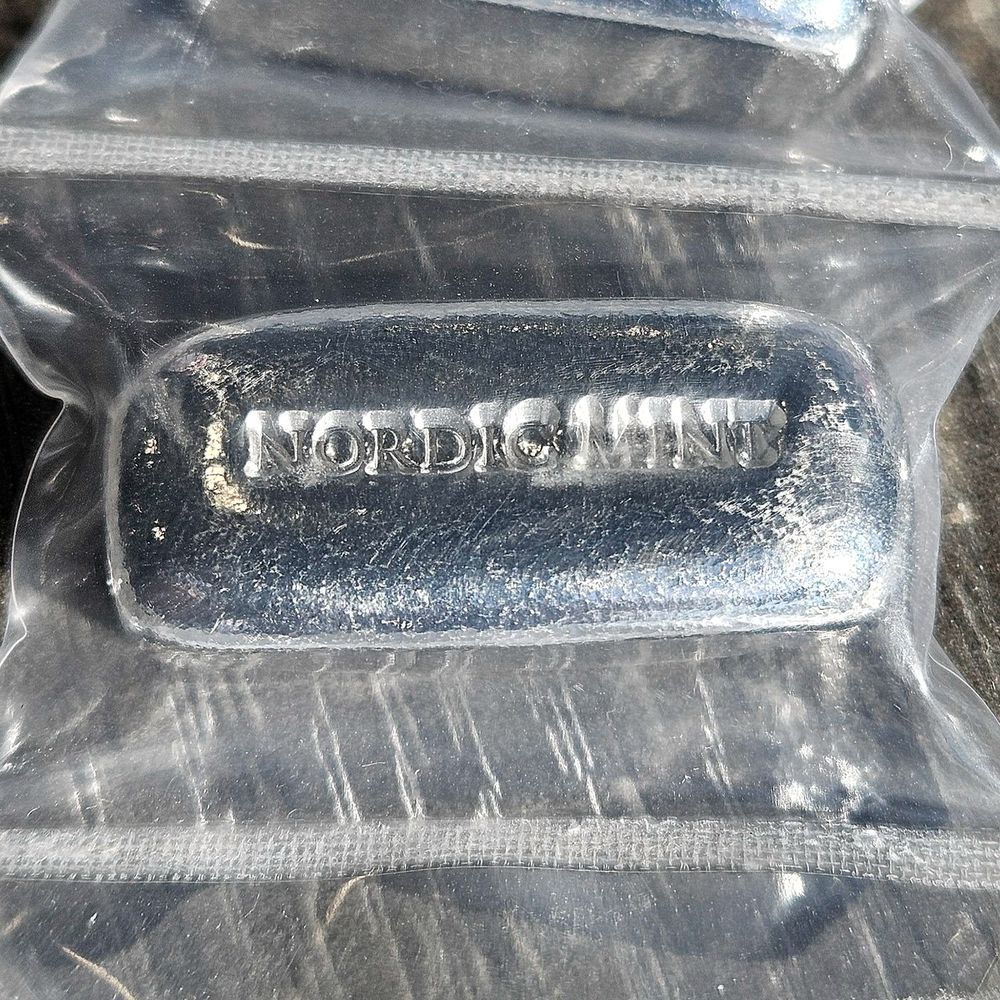
$54.14
.999 fine silver, poured by hand in Fargo, North Dakota, so each bar’s shape varies a little.
View itU.S. orders of $2,000 or more ship free and insured.
New to Ausecure? Open a free account to buy at live prices. A+ BBB rated, trusted since 2009, and every order 100% insured.
Frequently asked questions
How did gold close today?
Gold closed at $3,849.21 an ounce at 5:00 PM ET on Nov 17, 2026, down −$6.64 / −0.17% from Monday. It traded between $3,836.96 and $3,891.08. For the current bid and ask, see our live metal prices page.
Why did gold jump at 10:30 AM ET and then give it back?
Gold rose +$35 from 10:15 to 10:45 AM ET as Nasdaq 100 futures fell 1.2% and Treasury yields fell. Hormuz and Qeshm headlines came out in the same window. Over the next six hours it slid back in small steps, with no single trigger we can find.
Why did silver rise while gold fell?
Silver’s gain came overnight, when it climbed to $48.02 by 12:30 AM ET. In New York it moved with gold and ended a little below its morning level. The ratio fell to 81.2 from Monday’s one-year high of 82.1.
Is a quiet close near $3,850 a good time to buy gold?
We don’t give investment advice, and no one can reliably call short-term lows. Gold has held above Monday night’s $3,832.46 low for a day, and the Fed’s minutes come out Wednesday. Some buyers wait; others buy a fixed amount on a schedule, which our Auto-Buy program does automatically. Whatever you choose, compare the premium over spot.
This note is general market commentary from the Ausecure trading desk, based on data available at 5:00 PM ET on Nov 17, 2026. It is for informational purposes only and is not investment, tax or financial advice, or a recommendation to buy or sell any product. Ausecure is a dealer in physical precious metals and earns revenue from the products discussed. Precious-metal prices can go down as well as up, and past performance does not guarantee future results. Consider your own circumstances, and speak with a qualified adviser if you need one, before you buy.
Sources: Gold and silver: Ausecure prices (midpoint of our bid and ask; earlier intraday moves and long-run history: spot daily closes); dollar index: Ausecure calculation from spot exchange rates; U.S. Treasury (daily yield curves and daily real yield curves); TreasuryDirect (bill auction results); Federal Reserve Board (G.17 Industrial Production and Capacity Utilization, Nov 17; Waller remarks, Nov 17; calendar); U.S. Census Bureau (retail sales); Bureau of Labor Statistics (import prices); National Association of Home Builders (Housing Market Index, November 2026); Reuters (Musalem remarks); CNBC (Nvidia results, VIX, outages, Trump remarks); Al Jazeera (Hormuz ship tally); Times of Israel (U.S. official on Qeshm strike); World Gold Council (China market update, Nov 17 2026); The Silver Institute (Interim Silver Market Review, Nov 12, 2026); Ausecure estimate: the Federal Reserve Bank of Atlanta Market Probability Tracker’s latest reading, moved with the 2-year Treasury yield since then; Freddie Mac (Primary Mortgage Market Survey); stock index futures CFDs (delayed); Forex Factory economic calendar (forecasts); Ausecure monthly trend model (spot daily closes and T-bill rates).
How this note is made: based on Ausecure’s own prices and data and the market sources listed above, then checked and approved by Ausecure before it was published.