



Pre-MarketNº 47·4Thursday, Nov 19, 2026 · 8:45 AM ET (7:45 AM CT)
Gold Price Today: Gold Slips 0.3% to $3,714 After a Night Below $3,700
Gold was $3,714.21 at 8:45 AM ET, down −$10.24 / −0.28% from Wednesday’s close. Overnight it fell $65 in 45 minutes to $3,693.54, its lowest since September 2025, and then won most of it back. Silver rose +$0.15 / +0.33% to $45.19.
By the Ausecure Trading Desk · 7 min read
Gold
$3,714.21
−0.28% from $3,724.45 Wednesday
−4.2% from $3,878.05 Nov 13 close
−4.2% from $3,875.65 Oct 30 close
−11.0% from $4,322.61 Dec 31, spot
Silver
$45.19
+0.33% from $45.04 Wednesday
−7.3% from $48.73 Nov 13 close
−8.0% from $49.13 Oct 30 close
−33.8% from $71.64 Dec 31, spot
Fed odds: Ausecure estimate, the Federal Reserve Bank of Atlanta Market Probability Tracker’s latest reading (Nov 17) moved with the 2-year Treasury yield since then; next Fed decision Dec 9, 2:00 PM ET. The 2-, 10- and 30-yr yields are the Nov 18 Treasury closes moved by Treasury note prices since (Ausecure estimate). The YTD tab uses spot daily closes. For general information only, not investment advice. Ausecure is a precious-metals dealer and sells the products discussed.
This pre-market note uses Ausecure prices as of 8:45 AM ET on Nov 19, 2026. For Wednesday’s session, when gold fell $123.77 to its lowest close in 14 months, read the market close note.
The short version
- Gold price today: gold is $3,714.21 an ounce at 8:45 AM ET, down −$10.24 / −0.28% from Wednesday’s 5:00 PM ET close of $3,724.45.
- Silver price today: silver is $45.19, up +$0.15 / +0.33%. The gold/silver ratio eased to 82.2 from 82.7.
- Overnight: gold fell from $3,758.73 to $3,693.54 between 9:15 and 10:00 PM ET. It broke the Sep 24, 2025 low of $3,717.52 on the way. By 12:30 AM ET it was back near $3,740.
- The timing: the drop came 30 to 40 minutes after reports that President Trump is weighing new strikes on Iran. Asian stocks fell too, but oil fell and Treasury prices held.
- Data: the Philadelphia Fed factory index fell to 6.3, far below forecasts, while its prices-paid index jumped to 58.2. Jobless claims rose to 203,000. Gold fell −$8.60 after the 8:30 AM ET release.
Why is gold down today?
Gold is down $10.24, but that hides a $65 range. It rose at the Asian open, broke a 14-month low late in the evening, bounced, and slid again before New York.
- The Asian open (6:00 to 9:15 PM ET). Gold rose +$34 to $3,758.73 in the 8:00 PM ET bar, on about three and a half times normal volume. Nasdaq 100 futures rose 0.7% in the same hours. We found no headline for it.
- The break (9:15 to 10:15 PM ET). Gold fell −$65 to $3,693.54. The 9:45 PM ET bar fell $24 and closed below the Sep 24, 2025 low of $3,717.52. The 10:00 PM ET bar traded through $3,700 on about three and a half times normal volume.
- The bounce (10:15 PM to 12:30 AM ET). Gold rose +$47 to $3,744.55 as Asian stock futures recovered.
- London (12:30 to 8:30 AM ET). Gold held between $3,726 and $3,742 until 6:45 AM ET. Then it slid to $3,710.64 as our dollar index rose and Brent crude added $1.40.
- The data (8:30 to 8:45 AM ET). Gold rose $8.50 in the five minutes before the release and lost $8.60 after it, to $3,714.21. Stock futures dipped 0.2% and Treasury prices rose.
The late-evening break was gold’s own. Bloomberg and Axios reported at 9:07 and 9:12 PM ET that Trump is weighing new strikes on Iran, with Israel pushing for a short campaign. In the 45 minutes of the drop, Nasdaq 100 futures and Japan’s Nikkei fell 0.6% and our dollar index rose 0.11. Brent fell $0.60 and the 2-year Treasury note price didn’t move, so it wasn’t oil or rates. Tokenized gold fell while bitcoin rose. Our read is that stop orders below the September 2025 low and $3,700 added to the selling. We can see the timing and the volume, not who sold. The fast rebound fits that read.
Gold, past two weeks
Today’s economic data and what it means
| Report | Forecast | Actual | What it means |
|---|---|---|---|
| Philly Fed index | 20.6 | 6.3 | November, 8:30 AM ET. Down from 20.9, a six-month low |
| Prices paid | n/a | 58.2 | November, Philadelphia Fed survey. Up 15 points, highest since April |
| Jobless claims | 198K | 203K | Week to Nov 14, 8:30 AM ET. Prior revised to 202K |
| Continuing claims | 1.710M | 1.763M | Week to Nov 7. Up 70,000 from a revised 1.693M |
- Philadelphia Fed
- The bank’s factory index fell to 6.3 in November from 20.9, against a forecast of 20.6. New orders slipped to −0.4, a fourth straight decline. Shipments rose to 25.7 and employment to 11.6.
- Factory prices
- The prices-paid index rose 15 points to 58.2, its highest since April. Prices received rose 7 points to 47.0, the highest since June 2022, the Philadelphia Fed said. Weaker orders with faster price rises give the Fed no reason to slow its hikes.
- Jobless claims
- Initial claims rose to 203,000 from a revised 202,000, the Labor Department’s figures showed. The four-week average is 197,750. Continuing claims rose 70,000 to 1.763 million, from a revised 1.693 million.
What it adds up to: slower factories and a softer job market, with prices still rising. Gold lost $8.60 after the release, and the 10-year Treasury yield slipped about 0.01 point. By our estimate December hike odds are 100%. Fed Vice Chair Philip Jefferson speaks at 9:25 AM ET, and the University of Michigan survey is out Friday.
How much was the dollar?
Our dollar index is 103.68, down −0.11% from Wednesday’s close. It peaked at 103.97 at 10:30 PM ET, during gold’s overnight break, and fell to 103.61 by 5:30 AM ET. Over the past two weeks gold is down −9.1% and the dollar is up +2.1%.
By our estimate the 10-year Treasury yield is 5.09% and the 30-year 5.42%, each up about 0.01 to 0.02 point from Wednesday’s close. The 2-year is about 4.82%, up 0.02 point. These are Treasury’s Wednesday closes moved by this morning’s Treasury note prices. Treasury put the 10-year real yield at 2.88% on Wednesday, up 0.10 point in five trading days. The average 30-year fixed mortgage rate was 7.11% in Freddie Mac’s survey of Nov 12, and the 15-year 6.45%. The next survey is out today at noon ET.
Gold vs. the U.S. dollar, % change over two weeks
Prices keep moving through the morning. Our live metal prices page has bid and ask for gold, silver, platinum and palladium, updated as the market moves.
The Fed: hike odds at 100%, six speakers today
No Fed official spoke overnight. Wednesday’s minutes showed almost all officials expect more hikes, as our market close note covered. Today brings Cleveland Fed President Beth Hammack at 8:50 AM ET and Vice Chair Philip Jefferson at 9:25 AM ET. Chicago’s Austan Goolsbee follows at 12:30 PM ET, Governor Michael Barr at 2:15 PM ET, Richmond’s Tom Barkin at 4:00 PM ET and Philadelphia’s Anna Paulson at 6:30 PM ET.
By our estimate, markets price a December 9 hike at 100%, up from 98.4% at Wednesday’s close. The Atlanta Fed’s Nov 17 reading was 98%. Odds of a second hike by January 27, to 4.25–4.50%, are 68.4%, up 2.3 points. Our estimate doesn’t split a quarter-point hike from a half-point one. It moves the Atlanta Fed tracker’s latest reading with the 2-year yield since then.
In Japan, Bank of Japan Governor Kazuo Ueda told parliament the bank “will continue to raise the policy interest rate.” The yen didn’t jump: the dollar stayed near 159.5 yen.
Iran, oil and the Gulf
The Iran-strike reports came just before gold’s overnight break. Gold didn’t move on the later Gulf headlines.
- Strike talk
- Trump is weighing new strikes on Iran as Israel pushes for a four- to seven-day campaign, Axios reported. Bloomberg reported Trump said Iran is looking at gas and bioweapons but played down the threat. No decision was announced.
- Hormuz
- Iran’s Revolutionary Guards said two supertankers hit mines in the Strait of Hormuz, Anadolu reported. The claim hasn’t been confirmed by the ship owners.
- Riyadh
- A Houthi strike damaged the tower of Saudi Arabia’s Public Investment Fund in Riyadh, Reuters reported.
- Oil
- Brent crude fell to about $93.07 during gold’s 10:00 PM ET drop and rose to about $94.20 by 8:30 AM ET.
- China summit
- Trump, Xi Jinping and Vladimir Putin held their first three-way talks in China, covering nuclear arms and the war in Ukraine, ABC News reported. Gold traded between $3,726 and $3,737 as the meeting was reported.
Stocks before the open
At 8:45 AM ET, S&P 500 index futures were up +1.0% and Nasdaq 100 futures up +1.8% from Wednesday’s close. Japan’s Nikkei rose 1.9% and Hong Kong’s Hang Seng fell 1.1%. Europe was flat to down 0.4%. On Wednesday the S&P 500 fell 0.2% and the Dow 1.1%. Stock futures rose overnight while gold fell, so gold’s drop wasn’t part of a broad sell-off.
Silver price today: up 0.33%, at $45.19
Silver is $45.19, up $0.15 from Wednesday’s close of $45.035. It peaked at $45.90 in the 8:00 PM ET bar. It fell with gold in the late-evening break, to $44.53 at 10:00 PM ET, below its Sep 26, 2025 low of $44.61. It was back above $45 by 10:45 PM ET.
Silver bounced harder than gold. The ratio fell −0.5 from 82.7 at Wednesday’s close to 82.2. It hit 83.0 at the 10:00 PM ET low, when silver fell further than gold. The Silver Institute still forecasts a sixth straight market deficit in 2026, of 35 million ounces.
Gold/silver ratio, past two weeks
Gold/silver ratio: how it has moved with gold over 90 days
Silver has moved with gold and further. From daily spot closes, Aug 20 to Nov 18 (65 trading days):
Gold/silver ratio, daily spot close
Biggest one-day risesBiggest one-day falls
- Sep 10Ratio +2.48 as gold fell 1.9% and silver 5.5%.
- Oct 14Ratio +3.46, the biggest one-day rise, as gold fell 1.3% and silver 6.0%.
- Oct 20Ratio −1.38 as gold fell 0.4% and silver rose 1.6%.
- Oct 22Ratio +2.29 as gold fell 2.8% and silver 5.8%.
- Nov 4Ratio −1.19 as gold rose 3.3% and silver rose 4.9%.
- Nov 16Ratio +2.45 as gold fell 0.7% and silver 3.7%.
Each dot is one day in the 90 days. Across: gold’s change. Up: silver’s.
Black line: silver’s average move against gold’s over 90 days. Dashed: a move the same size as gold’s. 1 month: 1.5×. 1 year: 1.9×.
| Level | Ratio | Note |
|---|---|---|
| Wednesday’s close | 82.67 | Nov 18 |
| 1-month low | 71.13 | Oct 20 |
| 90-day low | 65.00 | Sep 22 |
| 1-year low | 46.29 | Jan 27 |
1 month: since the Oct 16 close. 90 days: since Aug 20. 1 year: since Nov 18, 2025. All to Wednesday’s close, from daily spot closes.
Over 90 days silver’s daily move has averaged 1.50 times gold’s, and 1.45 times over the past month. Wednesday’s close of 82.67 was the top of the 1-month, 90-day and 1-year ranges. This morning silver is up 0.33% while gold is down 0.28%, so the ratio fell to 82.2. Most of the change came in the bounce after gold’s 10:00 PM ET low.
Gold/silver ratio: where 82.2 sits in the longer history
From daily spot closes since 2000, and the 2-year Treasury yield from the Federal Reserve:
- Last this high
- Before Wednesday, the last daily close above 82.2 was 82.81 on Nov 7, 2025, with gold at $4,001.30 and silver at $48.32. A month later the ratio was 72.05, with gold up 4.7% and silver up 20.4%. That is one case, inside silver’s run to its record.
- A year ago
- A year ago (Nov 18, 2025) the ratio was 80.22, with gold at $4,067.40 and silver at $50.70. To Wednesday’s close gold is down 8.4% over the year and silver 11.1%.
- Before gold’s record
- The ratio was 90.83 six months before gold’s record close of $5,418.50 on Jan 28, 2026. It was 82.64 three months before, 60.06 a month before and 46.37 on the day.
- Since the record
- Gold is down 31.3% and silver 61.4%, to Wednesday’s close.
- Rate days
- Since gold’s record, the 2-year yield rose 0.05 point or more on 31 days. Gold fell on 24 of them, and the ratio rose on 23. This morning the 2-year is up about 0.02 point, so today isn’t a rate day on that measure.
- Other jumps to this level
- Since 2000 the ratio has jumped to about 82 after weeks well below it four times: October 2008, February 2016, April 2022 and July 2024. Three months later it was lower three times and higher once, in 2022. Four cases is a small sample, and it is history, not a forecast.
| Ratio level | Ratio | Why it matters |
|---|---|---|
| Night high | 83.00 | 10:00 PM ET bar, at gold’s low |
| Nov 7, 2025 | 82.81 | The last close above 82.2 before this week |
| Wed close | 82.70 | A one-year closing high |
| This morning | 82.20 | 8:30 to 8:45 AM ET bar |
| Night low | 81.96 | 7:45 PM ET bar, during the Asian-open rise |
| A year ago | 80.22 | Nov 18, 2025 daily close |
| 1-month median | 77.47 | Daily closes since Oct 16 |
| 90-day median | 68.59 | Daily closes since Aug 20 |
| At gold’s record | 46.37 | Jan 28, 2026, gold’s record close |
In the past 90 days, the ratio rose most on days gold fell and silver fell further. This morning went the other way, with silver up and gold down. That is a description of recent trading, not a forecast.
Gold and silver price levels we’re watching
| Level | Gold | Silver | Why it matters |
|---|---|---|---|
| Night highs | $3,758.73 | $45.90 | 8:00 PM ET bar, at the Asian open |
| Wed close | $3,724.45 | $45.04 | 5:00 PM ET Wednesday, where today’s move started |
| Sep 2025 lows | $3,717.52 | $44.61 | Sep 24 and Sep 26, 2025. Both broke at 9:45 to 10:00 PM ET |
| This morning | $3,714.21 | $45.19 | 8:30 to 8:45 AM ET bar close |
| Round number | $3,700 | $45.00 | Gold traded through it at 10:00 PM ET. Silver closed below for an hour |
| Night lows | $3,693.54 | $44.53 | 10:00 PM ET bar, the lowest since September 2025 |
| Earlier lows | $3,683.55 | $43.78 | Sep 22 and Sep 25, 2025, the last sessions that traded lower |
Gold’s range since the reopen is $65.19.
Where several studies agree
| Level | Gold | Silver | Why it matters |
|---|---|---|---|
| Resistance 2 | $3,768– | $45.90– | Gold: daily and weekly pivots, 78.6% pullback of the Aug 2025 to Jan 2026 rally. Silver: overnight high and $46 |
| Resistance 1 | $3,750– | $45.55– | Gold: round number, monthly pivot support, overnight high. Silver: Oct 28, 2025 low and the daily pivot |
| Support 1 | $3,684– | $45.00– | Gold: overnight low and the Sep 22, 2025 low. Silver: round number, Wednesday’s close, weekly pivot support |
| Support 2 | $3,624– | $44.53– | Gold: one average day below Wednesday’s close, daily and monthly pivot supports. Silver: overnight low, Wednesday’s low, monthly pivot |
| Support 3 | $3,540– | $43.78– | Gold: third daily pivot support and $3,550. Silver: Sep 25, 2025 low, $44 and the daily pivot support |
Studies used: swing highs and lows since January 2025, session, day, week and month highs and lows, daily, weekly and monthly pivots, moving averages, average daily range, Fibonacci pullbacks and round numbers. The zone our market close note had at gold’s price, $3,717 to $3,725, broke overnight and now sits above as resistance. Gold has traded around $3,624 to $3,634 on 10 days since January 2025 and around $3,540 to $3,550 on five, so prices below the overnight low have little trading history. These are past levels, not a forecast.
Trend check
On our monthly trend model, both metals read bear as of the Oct 30 month-end. Their 12-month and one-month returns, after cash returns, were both down. From 2008 to October 2026, gold rose in the month after a bear month 49% of the time; that is history, not a forecast. Gold’s live 12-month return, to Wednesday’s close, is 13.7% below zero, so it would take a 15.9% rise to turn it positive. Silver’s is 18.6% below zero.
Economic calendar: what’s next for gold
- Thu Nov 19, 9:25 AM ET
- Fed Vice Chair Philip Jefferson. Freddie Mac’s mortgage survey at noon ET. Chicago Fed President Austan Goolsbee at 12:30 PM ET, Governor Michael Barr at 2:15 PM ET, Richmond Fed President Tom Barkin at 4:00 PM ET.
- Fri Nov 20, 8:25 AM ET
- Governor Christopher Waller speaks. University of Michigan consumer survey at 10:00 AM ET. Governor Lisa Cook at 12:15 PM ET.
Market Notes by email
Gold and silver insights in your inbox
The weekly email every weekend, plus monthly, quarterly and yearly wrap-ups: how gold and silver closed, what moved them, and the levels ahead.
Read the latest weekly email (Sunday, Nov 15) or the October wrap-up.
This weekAusecure closing ask
| Day | Gold | Change | Silver | Silver change |
|---|---|---|---|---|
| MonNov 16 | $3,860.40 | −0.6% | $47.12 | −3.6% |
| TueNov 17 | $3,853.50 | −0.2% | $47.53 | +0.9% |
| WedNov 18 | $3,729.00 | −3.2% | $45.19 | −4.9% |
| ThuNov 19 | $3,629.20 | −2.7% | $43.01 | −4.8% |
| WeekendWeekly email | Read last week’s | |||
You’re subscribed.Our emails will go to .
Buying metal too? A free account lets you order at live prices and track every shipment.
What today’s move means if you buy physical gold or silver
Gold is $10.24 below Wednesday’s close and $20.67 above its overnight low. Silver is $0.15 higher.
- Your price
- Gold fell $24 inside one 15-minute bar last night. The price you lock in is the one on screen when you place the order.
- Premium
- Most products on our site show their “% over spot” under the price, so you can compare a coin with a bar on equal terms.
- Paying
- Wire, paper check and crypto via Uphold pay the listed price. Credit or debit card, Apple Pay and Google Pay pay the card price. U.S. orders of $2,000 or more ship free and insured.
- Retirement
- See which coins and bars meet the fineness rules on our IRA-eligible metals page.
- Selling
- We make two-way markets. Call the desk at 1-855-528-4653 for a live bid, or see how selling works.
If you would rather not time it, Auto-Buy places a recurring order for American Eagles or a 10 oz silver bar, weekly to every two months, at the live price on each order date. Every Auto-Buy order ships free and insured, you get a reminder before each one, and you can skip, pause or cancel anytime.
Silver, past two weeks
Coins and bars from the U.S. Mint, Royal Canadian Mint, PAMP, Valcambi and more: shop gold or shop silver. Every order is 100% insured, tracked and shipped discreetly.
From our store this morning
Our listed prices at 8:36 AM ET, for wire, paper check or crypto via Uphold; the card price is on each product page. Prices move with the live market and are confirmed when you order.

$1,032.03
.9999 fine gold from the Austrian Mint, €25 face value. Austrian legal tender. IRA-eligible.
View it
$3,866.05
.9999 fine gold from the Royal Canadian Mint, sealed in its assay card with a serial number. IRA-eligible.
View it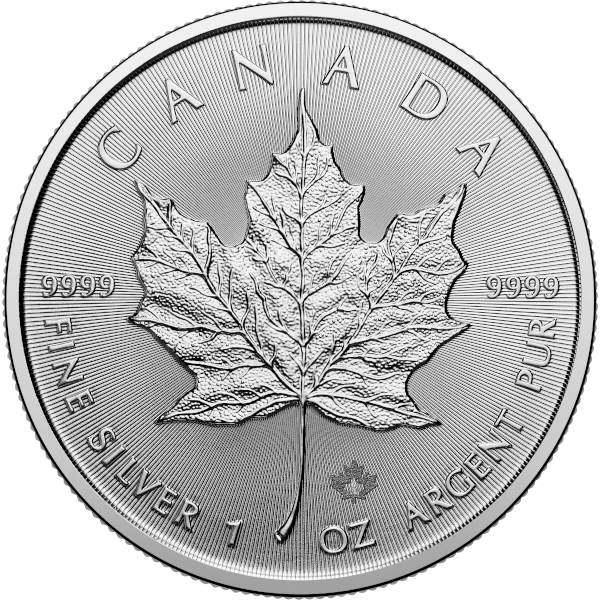
$50.05
.9999 fine silver from the Royal Canadian Mint, $5 CAD face value. IRA-eligible.
View it
$85.50
.999 fine silver from PAMP Suisse's Lunar Legend series, sealed in a PAMP assay card.
View itU.S. orders of $2,000 or more ship free and insured.
New to Ausecure? Open a free account to buy at live prices. A+ BBB rated, trusted since 2009, and every order 100% insured.
Frequently asked questions
What is the gold price today?
Gold was $3,714.21 an ounce at 8:45 AM ET on Nov 19, 2026, down −$10.24 / −0.28% from Wednesday’s close of $3,724.45. Since Wednesday evening’s reopen it has traded between $3,693.54 and $3,758.73. For the current bid and ask, see our live metal prices page.
Why did gold fall below $3,700 overnight?
Gold dropped $65 between 9:15 and 10:00 PM ET, through the Sep 24, 2025 low and $3,700. Reports that Trump is weighing new Iran strikes came out just before, and Asian stocks dipped. Oil and Treasury yields didn’t move with it, so our read is that stop orders below the old low added to the drop. Gold bounced $47 within two and a half hours.
What did this morning’s data do to gold?
The Philadelphia Fed index fell to 6.3 while its prices-paid gauge rose to 58.2, and jobless claims rose to 203,000. Gold fell $8.60 in the 15 minutes after the 8:30 AM ET release, with stock futures.
Why is silver up while gold is down?
Silver fell with gold in the late-evening break, to $44.53, then bounced harder. It is up 0.33% while gold is down 0.28%. That took the ratio down to 82.2 from a one-year closing high of 82.7.
Is now a good time to buy gold?
We don’t give investment advice, and no one can reliably call short-term lows. Gold is near its lowest since September 2025, and the Fed meets on Dec 9. Some buyers wait; others buy a fixed amount on a schedule, which our Auto-Buy program does automatically. Whatever you choose, compare the premium over spot.
This note is general market commentary from the Ausecure trading desk, based on data available at 9:00 AM ET on Nov 19, 2026. It is for informational purposes only and is not investment, tax or financial advice, or a recommendation to buy or sell any product. Ausecure is a dealer in physical precious metals and earns revenue from the products discussed. Precious-metal prices can go down as well as up, and past performance does not guarantee future results. Consider your own circumstances, and speak with a qualified adviser if you need one, before you buy.
Sources: Gold and silver: Ausecure prices (midpoint of our bid and ask; earlier intraday moves and long-run history: spot daily closes); dollar index: Ausecure calculation from spot exchange rates; Treasury yields: U.S. Treasury (daily yield curves) moved by Treasury note prices (Ausecure estimate); U.S. Treasury (daily real yield curves); Federal Reserve Bank of Philadelphia (Manufacturing Business Outlook Survey, November 2026); U.S. Department of Labor (weekly claims, via FRED); Bank of Japan (Governor Ueda’s statement to the Diet); Axios and Bloomberg (Iran strike reports); Anadolu (Hormuz); Reuters (Riyadh); ABC News (China summit); The Silver Institute (Interim Silver Market Review, Nov 2026); Federal Reserve Board (calendar); Ausecure estimate: the Federal Reserve Bank of Atlanta Market Probability Tracker’s latest reading, moved with the 2-year Treasury yield since then; Federal Reserve Bank of St. Louis (FRED: yields, stock index closes); Freddie Mac (Primary Mortgage Market Survey); stock index and oil CFDs (delayed); Forex Factory economic calendar (forecasts); Ausecure monthly trend model (spot daily closes and T-bill rates); Ausecure key-level study (spot daily and 15-minute bars).
How this note is made: based on Ausecure’s own prices and data and the market sources listed above, then checked and approved by Ausecure before it was published.