



Pre-MarketNº 45·3Wednesday, Nov 4, 2026 · 8:30 AM ET (7:30 AM CT)
Gold Price Today: Gold Rises 2.8% to $4,039 as Democrats Win Congress
Spot gold was $4,039.15 at 8:30 AM ET, up $108.82 from Tuesday’s close. It rose in two steps overnight as Democrats won the Senate and the House. Silver is up 4.1% at $51.85.
By the Ausecure Trading Desk · 8 min read
Gold
$4,039.15
+2.77% from $3,930.33 Tuesday
+4.2% from $3,875.65 Oct 30 close
+4.2% from $3,875.65 Oct 30 close
−8.6% from $4,341.10 Dec 31, futures
Silver
$51.85
+4.10% from $49.80 Tuesday
+5.5% from $49.13 Oct 30 close
+5.5% from $49.13 Oct 30 close
−27.7% from $70.13 Dec 31, futures
Fed odds from fed funds futures (our calculation); next Fed decision Dec 9, 2:00 PM ET. The YTD tab uses COMEX futures daily closes. For general information only, not investment advice. Ausecure is a precious-metals dealer and sells the products discussed.
This pre-market note uses spot prices as of 8:30 AM ET on Nov 4, 2026. For Tuesday’s session, when gold closed down $16.42 at $3,930.33, read the market close note.
The short version
- Gold price today: spot gold is $4,039.15 an ounce at 8:30 AM ET, up $108.82 (2.77%) from Tuesday’s 5:00 PM ET close of $3,930.33.
- The election: Democrats won control of the Senate and the House, the Associated Press reported overnight.
- Overnight: gold rose $34 as the first results came in after 8:00 PM ET, then $60 after the Senate call. It has closed above $4,000 since 1:00 AM ET. The night’s high was $4,051.62.
- Silver price today: spot silver is $51.85, up $2.04 (4.10%). The gold/silver ratio fell to 77.9 from 78.9.
- Data today: ADP said private employers added 86,000 jobs in October, above the 67,000 forecast. Gold held its gains. The ISM services index is due at 10:00 AM ET.
Why is gold up today?
Gold rose on the election results. The first step came with a weaker dollar, lower Treasury yields and falling stock futures. The larger second step came with no dollar or rate move at all.
- First results (8:10 to 8:35 PM ET Tuesday). Gold futures rose $34 in 25 minutes. Volume was nearly six times normal. S&P 500 futures fell 0.6% and the dollar index fell 0.3%. The 2-year Treasury yield fell about 0.04 point.
- A pullback (8:45 to 10:45 PM ET). Gold gave back $24 to $3,934. Silver fell to its night low of $48.96 at 10:00 PM ET.
- The Senate call (11:40 PM ET). The Associated Press reported that Democrats had retaken the Senate. Gold rose $16 in the next 15 minutes.
- The main leg (12:30 to 1:25 AM ET). Gold rose $60 to $4,028 on volume about four times normal. The dollar and the 2-year yield did not move. Shanghai silver rose faster than New York’s as its afternoon session opened. We found no headline timed to the start. AP reported the Democrats had won the House at 1:27 AM ET, as the leg ended.
- Europe (3:00 to 8:30 AM ET). Gold held between $4,031 and $4,051.62. Brent crude fell $2.70 in that time, and gold didn’t follow it.
Our read is that buyers in New York and then Asia added gold as the Democratic sweep became clear. We can see the timing, the volume and the Shanghai lead, not who bought.
Gold spot (XAU/USD), past two weeks
Today’s economic data and what it means
Two U.S. reports came out before this note. A third is due at 10:00 AM ET.
| Report | Forecast | Actual | What it means |
|---|---|---|---|
| ADP jobs | 67K | 86K | October, 8:15 AM ET. Hiring held up. September was revised to 86,000 |
| Trade balance | −$107.9B | −$105.0B | September, 8:30 AM ET. A slightly smaller deficit than forecast |
| ISM services | 54.8 | due | October, 10:00 AM ET. September was 54.9 |
- ADP employment (ADP Research)
- Private payrolls rose 86,000 in October, above the 67,000 forecast. September was revised down to 86,000 from 90,000. Pay for workers who stayed in their jobs rose 3.0% from a year earlier, and 4.8% for job-changers. Firm hiring and pay keep the case for a December hike alive. Gold futures dipped $3 in the ten minutes after the release, then held.
- Trade balance (Census Bureau and BEA)
- The September deficit was $105.0 billion, against a $107.9 billion forecast. August was revised to $105.7 billion. Gold futures eased $4 in the next five minutes.
- Treasury refunding
- The Treasury will sell $125 billion of 3-, 10- and 30-year debt next week, with auctions on Nov 9, 10 and 12. It kept auction sizes unchanged and expects to for the next several quarters.
What it adds up to: ADP and wage growth support the Fed’s hiking case, but they didn’t move gold. The bigger tests are ISM services at 10:00 AM ET and Friday’s October jobs report, forecast at 65,000.
How much was the dollar?
The U.S. Dollar Index is 101.14, down 0.70% from Tuesday’s close and its lowest in a month. Most of the drop came during the election results. Over the past two weeks gold is down 2.1% and the dollar is down 0.5%.
The 10-year Treasury yield is 4.92%, down 0.05 point from Tuesday. The 30-year is 5.29%, down 0.04 point. The 2-year is 4.61%, down 0.03 point. Treasury’s Tuesday figures had the 10-year at 4.95% and the 30-year at 5.32%. The 10-year real yield was 2.65% on Tuesday, up 0.03 point, the Treasury said. The average 30-year fixed mortgage rate was 7.24% in Freddie Mac’s weekly survey (Oct 29), down 0.08 point from a week earlier. The 15-year was 6.60%.
Gold vs. the U.S. dollar, % change over two weeks
Prices keep moving through the morning. Our live metal prices page has bid and ask for gold, silver, platinum and palladium, updated as the market moves.
Midterm results: Democrats win the House and Senate
- Senate
- The Associated Press reported at 11:40 PM ET that Democrats had retaken the Senate. Republicans held 53 seats before the vote. AP and NPR named Democratic pickups in Iowa, Kansas, Texas, South Carolina, Ohio, North Carolina and Maine, where Sen. Susan Collins conceded.
- House
- AP reported at 1:27 AM ET that Democrats had won the House as well. Final seat counts for both chambers were not available at 8:30 AM ET.
- Markets
- S&P 500 futures fell as the first results came in, then recovered. They were up 0.92% at 8:21 AM ET, with Dow futures up 1.88% and Nasdaq 100 futures up 0.17%. The VIX was 18.49.
Iran, oil and other central banks
None of the Iran items below moved gold at the time. Gold’s move came with the U.S. results.
- Iran on the vote
- Parliament speaker Mohammad Bagher Ghalibaf wrote on X at 1:00 AM ET that “Americans said NO TO WAR, and we endorse this message,” Al Jazeera reported. Other senior officials made similar comments.
- Supreme leader
- In a message carried by Al Jazeera at 6:05 AM ET, Ayatollah Mojtaba Khamenei warned that renewed U.S. attacks would “take on much broader dimensions.” He said hopes of a change through U.S. “party or factional shifts” were mistaken. Iran’s WANA news agency carried the same message.
- “Maximum deterrence”
- Al Jazeera’s live blog said Iran has a plan ready for an immediate response to any new U.S. attack. It summarized statements from Tuesday; we could not trace the original statement.
- Hormuz
- Iran’s Revolutionary Guards said four tankers were set on fire by mines near the strait, Reuters reported at 10:50 PM ET, citing Tasnim. No one else has confirmed it. Oil fell after the claim.
- Oil
- Brent crude was $101.80 at 8:30 AM ET, down 2.5% from Tuesday’s close. Its overnight high was $104.96.
- Europe
- Euro-area inflation rose to 4.0% in October from 3.8%, as forecast, Reuters reported. The European Central Bank’s wage tracker points to 2.8% pay growth in the first half of 2027.
- Bank of England
- It announces its rate decision on Thursday at 7:00 AM ET.
World Gold Council: central banks bought 61 tonnes in September
Central banks reported 61 tonnes of net gold purchases in September, the highest monthly total of 2026, according to the World Gold Council. Poland and China led the buying. For the year to date, reported purchases were 228 tonnes, 7% less than a year earlier. Gold had no measurable move when the report came out at 4:00 AM ET.
Silver price today: up 4.1%, above $51
Spot silver is $51.85, up $2.04 from Tuesday’s close of $49.80. It fell to $48.96 at 10:00 PM ET, then rose with gold after the Senate call. It closed above $51 at 12:45 AM ET and has stayed there. Its overnight high was $52.25 at 5:15 AM ET.
Silver rose 4.1% to gold’s 2.8%. The gold/silver ratio fell to 77.9 from 78.9 at Tuesday’s close, after reaching 80.03 at 10:45 PM ET. Shanghai silver rose more than New York’s during the 12:30 AM ET leg. We found no silver-specific news.
Gold/silver ratio, past two weeks
Gold/silver ratio: how it has moved with gold over 90 days
Silver has moved with gold and further. From daily COMEX futures closes, Aug 5 to Nov 3 (64 trading days):
Gold/silver ratio, daily futures close
Biggest one-day risesBiggest one-day falls
- Aug 10Ratio −1.59 as gold rose 0.5% and silver rose 2.8%.
- Aug 20Ratio −1.95 as gold rose 0.6% and silver rose 3.5%.
- Sep 10Ratio +2.91 as gold fell 1.2% and silver 5.4%.
- Oct 14Ratio +3.34, the biggest one-day rise, as gold fell 1.7% and silver 6.1%.
- Oct 22Ratio +1.87 as gold fell 2.2% and silver 4.6%.
- Oct 30Ratio +2.17 as gold fell 3.3% and silver 5.9%.
Each dot is one day in the 90 days. Across: gold’s change. Up: silver’s.
Black line: silver’s average move against gold’s over 90 days. Dashed: a move the same size as gold’s. 1 month: 1.8×. 1 year: 1.9×.
| Level | Ratio | Note |
|---|---|---|
| 1-year high | 84.03 | Nov 4, 2025 |
| Tuesday’s close | 79.46 | Nov 3 |
| 1-month low | 68.29 | Oct 5 |
| 90-day low | 65.65 | Sep 9 |
| 1-year low | 44.16 | Jan 26, the day of silver’s highest close in the year |
1 month: since the Oct 2 close. 90 days: since Aug 5. 1 year: since Nov 3, 2025. All to Tuesday’s close, from daily COMEX futures closes.
Overnight fit the pattern on a big up day: gold rose 2.8% and the ratio fell 1.0. The intraday view shows the fall came in the main leg after midnight ET, when Shanghai led.
Gold/silver ratio: where 77.9 sits in the longer history
From daily COMEX futures closes since 2000, and the 2-year Treasury yield from the Federal Reserve:
- The last time the ratio was this high
- The last time the ratio was this high, before the past week, was Nov 26, 2025, when it closed at 78.71 with gold at $4,165 and silver at $52.92. Silver’s run to its record followed. A month later the ratio was 62.2, with silver up 32% and gold up 4%. That is one episode, not a forecast.
- A year ago
- A year ago (Nov 3, 2025) the ratio was 83.8, with gold at $4,014 and silver at $47.89. To Tuesday’s close, gold futures were down 1.8% over the year and silver up 3.5%.
- Before gold’s record
- The ratio was 87.7 six months before gold’s record close of $5,318.40 on Jan 29, 2026. It was 84.5 three months before, 62.2 a month before and 46.6 on the day. Silver’s record close, $115.08, came on Jan 26 with the ratio at 44.2.
- Since the record
- Gold futures are down 25.9% and silver 56.9%, to Tuesday’s close.
- Rate days
- Since gold’s record, the 2-year yield rose 0.05 point or more on 29 days. Gold fell on 22 of them. On the 22 days it fell that much, gold rose 0.5% on average and silver 0.3%. Today’s 2-year move is 0.03 point, below that line.
- Other jumps to this level
- Since 2000 the ratio has jumped to about 77.5 after weeks well below it four times before (February 2003, October 2008, September 2020, September 2021). Three months later it was lower in three of the four. Four cases is a small sample.
| Ratio level | Ratio | Why it matters |
|---|---|---|
| A year ago | 83.8 | Nov 3, 2025 futures close |
| Night high | 80.03 | 10:45 PM ET, at silver’s low |
| Tue futures | 79.46 | The highest daily futures close in 90 days |
| Tuesday’s close | 78.92 | Spot, where today’s move started |
| Last this high | 78.71 | Nov 26, 2025, before silver’s run to $115 |
| This morning | 77.91 | 8:15 AM ET bar |
| Night low | 77.53 | 1:15 AM ET, at the end of the main leg |
| 90-day median | 68.5 | Daily futures closes since Aug 5 |
| At gold’s record | 46.6 | Jan 29, 2026, gold’s record close |
In the past 90 days, the ratio has fallen on most of gold’s big up days, and it did so overnight. That is a description of recent trading, not a forecast.
Gold and silver price levels we’re watching
| Level | Gold | Silver | Why it matters |
|---|---|---|---|
| Night highs | $4,051.62 | $52.25 | Gold’s from 7:30 AM ET, silver’s from 5:15 AM ET. No close above either |
| Round number | $4,050 | $52.00 | No gold close above $4,050. Silver closed above $52 for part of the night and is below it now |
| Round number | $4,000 | $51.00 | Gold has closed above $4,000 since 1:00 AM ET; silver above $51 since 12:45 AM ET |
| Recent highs | $3,970.89 | $50.88 | Gold’s Friday U.S.-session high and silver’s Monday night high. Both broke after midnight ET |
| Tue close | $3,930.33 | $49.80 | 5:00 PM ET Tuesday, where today’s move started |
| Night low | $3,919.90 | $48.96 | Gold’s at 7:30 PM ET, silver’s at 10:00 PM ET |
Gold’s range since the reopen is $131.72, more than twice a typical full day over the past month. Gold is $68 above Friday’s U.S.-session high.
Trend check
On our monthly trend model, both metals read bear as of the Oct 30 month-end. Their 12-month and one-month returns, after cash returns, were both down. Since 2002, gold rose in the month after a bear month 49% of the time; that is history, not a forecast. At this morning’s futures price, the model’s live reading for silver is back to a correction, with its 12-month return 4.2% above zero. Gold would need to rise about 2.9% for its 12-month return to turn up.
What the Fed is expected to do next
Fed funds futures imply about 77% odds of a quarter-point hike at the December 9 meeting, as of 8:20 AM ET, down from 84% at Tuesday’s close. The odds of a hike at the January 27 meeting itself are about 28%. Counting both meetings, futures price about 84% odds of at least one hike by January 27.
So the Fed still has room to tighten in the market’s eyes. Futures price at least one hike by March 17 at about 93%. Today’s ADP report and pay data point the same way. The election took 7 points off the December odds, but the 2-year yield fell only 0.03 point.
No Fed releases or speeches came out overnight, and none are scheduled today. Governor Michelle Bowman speaks on Friday.
Economic calendar: what’s next for gold
- Wed Nov 4, 9:30 AM ET
- U.S. stock market open, and the first look at mining shares.
- Wed Nov 4, 10:00 AM ET
- ISM services index for October, forecast at 54.8.
- Wed Nov 4, 10:30 AM ET
- U.S. crude oil inventories (Energy Information Administration).
- Thu Nov 5
- Bank of England decision (7:00 AM ET), jobless claims (8:30 AM ET) and Freddie Mac’s mortgage survey (noon).
Market Notes by email
Gold and silver insights in your inbox
The weekly email every weekend, plus monthly, quarterly and yearly wrap-ups: how gold and silver closed, what moved them, and the levels ahead.
Read the latest weekly email (Saturday, Oct 31) or the October wrap-up.
This weekAusecure closing ask
| Day | Gold | Change | Silver | Silver change |
|---|---|---|---|---|
| MonNov 2 | $3,950.70 | +1.8% | $50.78 | +3.1% |
| TueNov 3 | $3,934.20 | −0.4% | $49.93 | −1.7% |
| WeekendWeekly email | Read last week’s | |||
You’re subscribed.Our emails will go to .
Buying metal too? A free account lets you order at live prices and track every shipment.
What today’s move means if you buy physical gold or silver
Gold is about $109 above Tuesday’s close and silver about $2 above it. Overnight, gold traded in a $132 range.
- Your price
- Gold moved $60 in under an hour overnight. The price you lock in is the one on screen when you place the order.
- Premium
- Most products on our site show their “% over spot” under the price, so you can compare a coin with a bar on equal terms.
- Paying
- Wire, paper check and crypto via Uphold pay the listed price. Credit or debit card, Apple Pay and Google Pay pay the card price. Domestic orders paid by wire qualify for free insured shipping.
- Retirement
- See which coins and bars meet the fineness rules on our IRA-eligible metals page.
- Selling
- We make two-way markets. Call the desk at 1-855-528-4653 for a live bid, or see how selling works.
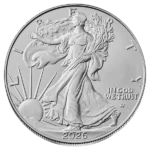
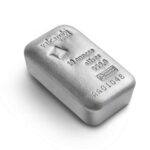
If you would rather not time it, Auto-Buy places a recurring order for American Eagles or a 10 oz silver bar, weekly to every two months, at the live price on each order date. Every Auto-Buy order ships free and insured, you get a reminder before each one, and you can skip, pause or cancel anytime.
Silver spot (XAG/USD), past two weeks
Coins and bars from the U.S. Mint, Royal Canadian Mint, PAMP, Valcambi and more: shop gold or shop silver. Every order is 100% insured, tracked and shipped discreetly.
New to Ausecure? Open a free account to buy at live prices. A+ BBB rated, trusted since 2009, and every order 100% insured.
Frequently asked questions
What is the gold price today?
Spot gold was $4,039.15 an ounce at 8:30 AM ET on Nov 4, 2026, up $108.82 (2.77%) from Tuesday’s close of $3,930.33. Since Tuesday evening’s reopen it has traded between $3,919.90 and $4,051.62. For the current bid and ask, see our live metal prices page.
Did the midterm results push gold above $4,000?
The timing says yes. Gold rose $34 as the first results came in and $60 after AP called the Senate for the Democrats. It crossed $4,000 shortly after midnight ET and has held above it.
Why did silver rise more than gold?
Silver rose 4.1% to gold’s 2.8%, and Shanghai silver led the main leg after midnight ET. Over the past 90 days silver has moved about 1.5 times as far as gold on an average day.
Is a jump like this a good time to buy gold?
We don’t give investment advice, and no one can reliably call short-term highs or lows. Gold swung $132 overnight, and ISM services, the Bank of England and Friday’s jobs report are still ahead. Some buyers wait for a pullback; others buy a fixed amount on a schedule, which our Auto-Buy program does automatically. Whatever you choose, compare the premium over spot.
This note is general market commentary from the Ausecure trading desk, based on data available at 8:30 AM ET on Nov 4, 2026. It is for informational purposes only and is not investment, tax or financial advice, or a recommendation to buy or sell any product. Ausecure is a dealer in physical precious metals and earns revenue from the products discussed. Precious-metal prices can go down as well as up, and past performance does not guarantee future results. Consider your own circumstances, and speak with a qualified adviser if you need one, before you buy.
Sources: OANDA spot gold and silver, TVC dollar index, Treasury yields and Brent crude via TradingView; CBOT 30-day fed funds futures (Ausecure calculation); U.S. Treasury (daily yield curves, quarterly refunding statement); Freddie Mac (Primary Mortgage Market Survey); Federal Reserve Board calendar; Federal Reserve Bank of St. Louis FRED (2-year Treasury yield); ADP Research (National Employment Report); U.S. Census Bureau and Bureau of Economic Analysis (trade); World Gold Council (Central Bank Gold Statistics: September 2026, Nov 4, 2026); European Central Bank (wage tracker); Bank of England calendar; the Associated Press and NPR (election calls); Al Jazeera; WANA; Reuters (euro-area inflation; Tasnim tanker claim, as relayed); COMEX gold and silver futures, SHFE silver futures, Brent futures, Treasury futures, currencies and index data via Yahoo Finance and TradingView (delayed); Forex Factory economic calendar; Ausecure monthly trend model (COMEX front-month futures and T-bill rates via Yahoo Finance).
How this note is made: based on Ausecure’s own prices and data and the market sources listed above, then checked and approved by Ausecure before it was published.